Monitoring Dropbox
click to enlarge
I keep a cheap little server in my basement. Amongst other things it contains a full checkout of my dropbox. In this way, I always have a copy of all my data inside of my walls. The content lies in the trusted hands of a zfs file system, which allows me to take regular snapshots, so I don’t loose data by accidentally deleting stuff on one of my devices. I just sleep better this way.
Working for a monitoring vendor, monitoring the server is not optional. Especially for this box. It has a surprisingly low availability, since I manage to trigger my circuit breaker (“FI Sicherung”) twice a week while working “fixing” my lights, heating, garage doors, etc. 🤷. So I want to make sure, it comes up as expected and keeps on doing what it should. In this case this boils down to:
- Is the dropbox daemon running?
- How many files are left to sync?
And in case we there are a ton of files left:
- How long will it take until everything is synced up?
I made a little dashboard for this purpose over the weekend and posted it on twitter:
Created a little @circonus dashboard to monitor dropbox syncing my 1TB drive. Pretty neat, and straightforward:
— Heinrich Hartmann (@heinrichhartman) January 30, 2018
0: Get an account (https://t.co/LsBRpSA6JC)
1: Add your host
2: Drop this into cron https://t.co/u9OxUSQSqv
3: Tweak the USE Dashboard https://t.co/QzMBcusHte pic.twitter.com/IfHLuUNHB5
Since people asked, I am going to elaborate a little here on what I did, and how you can do that, too, if you like. Of course, I will be using circonus for this, because I am most familiar with this tool. Everything I show here, can be done with a free-tier account, or mutatis mutandis with other tools as well.
System Metrics
First things first. Every box deserves system-level monitoring. With Circonus this is a single command which you can copy past from the Integrations page:
curl -sSL https://onestep.circonus.com/install | sudo bash -s -- --key ...
Now you will say “curl | sudo bash”, that’s a bad idea. I know I know. But … it just works. And it’s HTTPS. And I know who wrote that code. So we are all good.
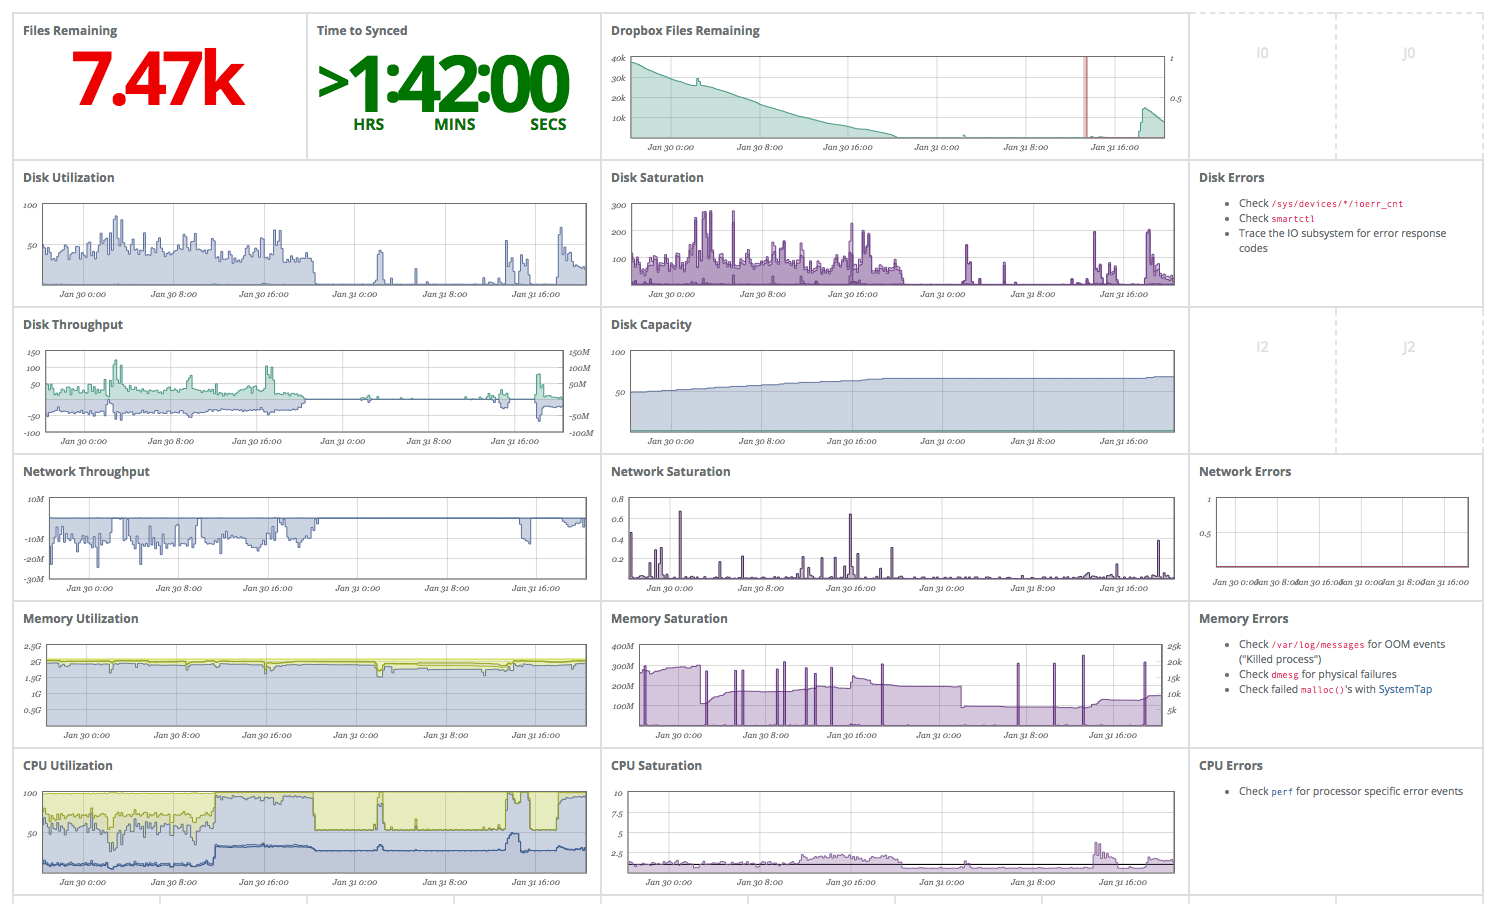
This command will install a monitoring agent (nad) on your system and publish a good set of system metrics, which are presented conveniently as USE Dashboard for you.
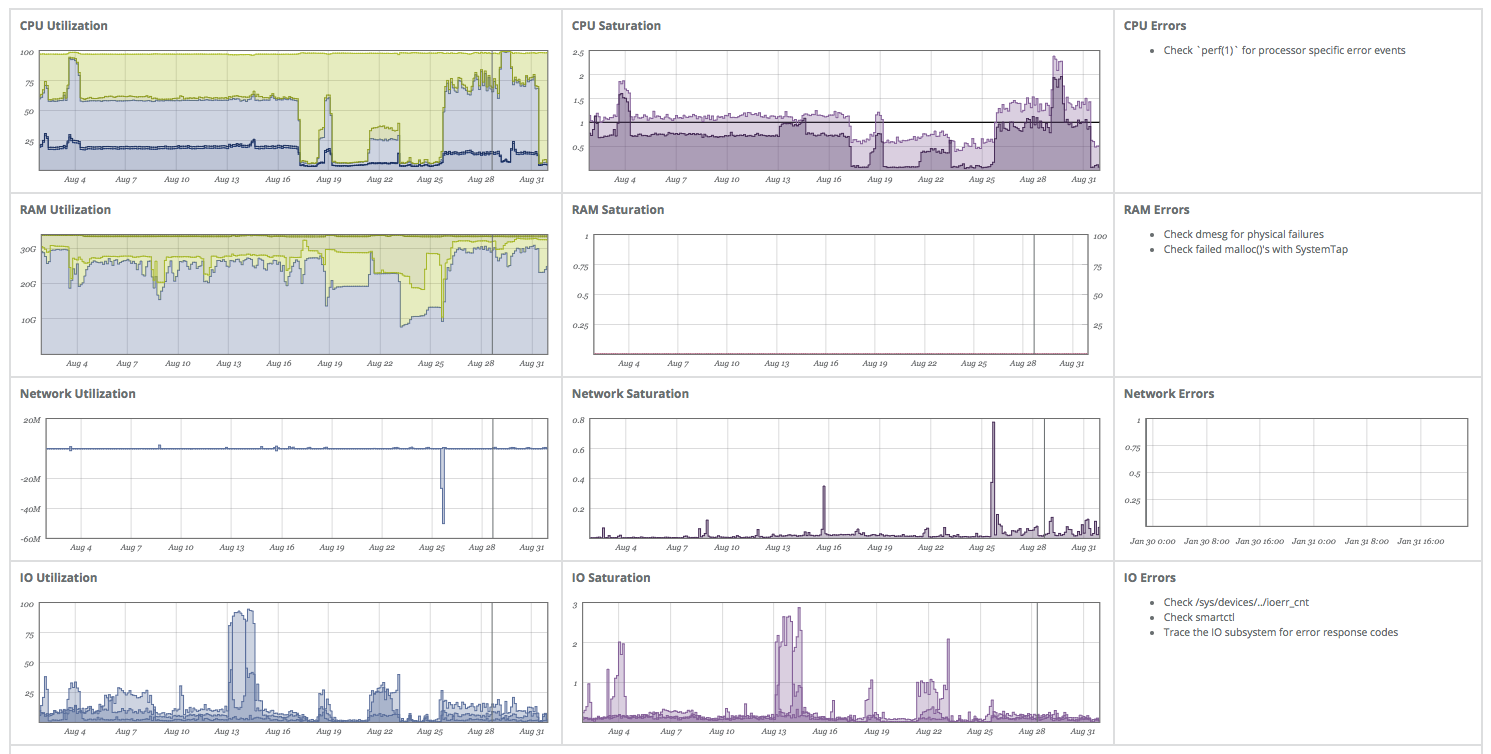
Looks pretty neat, eh? With this, I know if my system is up, and how the basic resources (CPU, memory, network, disks) are doing. Later we will add some dropbox graphs to this dashboard.
Gathering Dropbox Statistics
The main hero of this blog entry is the dropbox daemon.
Unfortunately dropbox does not offer machine-readable statistics (sigh).
We are left with the dropbox.py status command, which returns stuff like:
-
Dropbox isn't running! -
Starting -
Dropbox isn't responding! -
Syncing (51,938 files remaining, 2 mins left) Downloading 51,938 files (3,069 KB/sec, 2 mins left) - Or occasionally:
Up to date
So we need to parse out the information we are interested in. My first shot at this looked like this:
dropbox.py status \
  | grep remaining \
  | sed -e 's/remaining.*//' -e 's/[^0-9]//g'
This will pick out the “files remaining” line if there is any, then delete everything starting from the string “remaining” to get rid of the time estimate “2 mins left”.
Finally we delete all non numeric content and are left with a number: N=51938.
Tada! Good enough for a fist version.
After a few interatons, the script ended up looking like this:
#!/bin/bash
socat=/usr/bin/socat
grep=/bin/grep
sed=/bin/sed
dbx=$HOME/bin/dropbox.py
logger=/usr/bin/logger

# $1 metric name
# $2 value
function METRIC {
  logger -t dropbox-mon "metric $1: $2"
  printf 'dropbox`%s:%d|g' "$1" "$2" | $socat -t 0 STDIN UDP:localhost:8125
}

METRIC "count" "$(pgrep -c dropbox)"

STATUS="$($dbx status)"
case "$STATUS" in
  *"Up to date"*)
    METRIC "remaining" 0;
    exit 0;
    ;;
  *"files remaining"*)
    N=$(echo $STATUS \
        | $grep remaining \
        | $sed -e 's/remaining.*//g' -e 's/[^0-9]//g')
    METRIC "remaining" "$N"
    exit 0
    ;;
  *)
    exit 1
esac
Comments:
-
We will run this script via crontab(5), which is famous for invoking arcane shells and not setting up the environment (Thanks cron 🤐). So let’s be explicit about where to find the programs we use.
-
We want to send out the data we found as a metric, so we create a function for it. The implementation is explained below.
-
We use pgrep(1) to count the number of dropbox processes that are currently running (should be 0 or 1) and publish the result as a metric “count”.
-
Finally we parse the output of
dropbox.py statusin a more formal manner:- If we are up to date, we emit 0 as value for the “remaining” metric.
- If we have files remaining, we do as before.
- Otherwise, we don’t emit anything, and exit with RC=1 signaling an error condition.
Sending Custom Metrics to Circonus
There are many ways to send metrics to Circonus. Two of my favorite ones are:
Option 1 is certainly a good one, and I might go for it next time. We will follow option 2 here. Since a while ago nad has an integrated statsd server, that allows you to submit metrics via UDP in statsd format. In our case the payload we want to send looks like this:
dropbox`count:1|g
dropbox`remaining:5122|g
The usual way to do this from the command line would be using nc(1)
echo "dropbox`count:1|g" | nc -u localhost 8125
echo "dropbox`remaining:5122|g" | nc -u localhost 8125
Unfortunately nc has the bad habbit of hanging occasionally in this situation. Others have solved that by using socat(1) instead. So I copy pasted their code and went with it 😛. This is how I arrived at that function listed above:
# $1 metric name
# $2 value
function METRIC {
  logger -t dropbox-mon "metric $1: $2"
  printf 'dropbox`%s:%d|g' "$1" "$2" | $socat -t 0 STDIN UDP:localhost:8125
}
Right. We actually write out some system logs as well, mainly for debugging purposes. It takes a while until metrics show up on graphs. Log lines become visible much more quickly.
We test this script by running it from the shell.
$ ./cron/dropbox.sh
You should then see log messages appearing in syslog:
tail -n2 /var/log/syslog
Jan 31 18:13:20 HomeFX dropbox-mon: metric count: 1
Jan 31 18:13:20 HomeFX dropbox-mon: metric remaining: 51222
If it does, type in crontab -e as your local user and add a line:
* * * * * ~/cron/dropbox.sh
This should run dropbox.sh every minute. Check syslog again, to see if this worked.
Configuring The Dashboard
You will need to activate the metric in order for Circonus to collect data from it, on the checks page (Integrations > Checks > (select check) > details > [Changes brokers and Metrics])
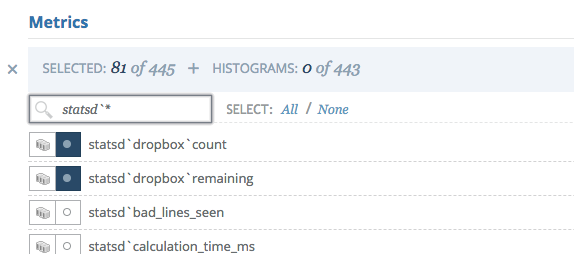
After you did that you should see data flowing into the metric on the check’s page.
Then add the metric to a new graph (Analytics > Graphs > Add Metric). Finally add the graph to the USE dashboard. I expanded the size of the dashboard a little and re-organized the graphs a little.
Finally I also added a forecasting widget to the dashboard.
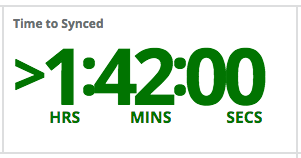
This usually tracks the time until we run out disk space (etc.), but it can be used to track the “time until we are fully synced” as well. Just put in the “dropbox remainig` metric under “usage” and 0 as resource limit. The resulting widget will show the time until you are fully synced (or “Out of Resources” if you are up to date.)
Alerting
Like every decent sys-admin, I have one alerting setup to notify me, when the box is down for more than an hour. With Circonus you can also alert on more subtle stuff like: Is dropbox stalled?
The stalled condition can be reformulated as:
(Is there stuff left to sync?) and (Is it not downloading stuff?)
Roughly translated into CAQL this is:
( // stuff left to sync?
  metric:average("b6266779-c835-4341-a71b-a250e68d2347",
                 "statsd`dropbox`remaining") > 0
)
and
( // not downloading stuff?
  metric:counter("b6266779-c835-4341-a71b-a250e68d2347",
                 "if`enp2s0`in_bytes") // download rate in byte/sec
  | rolling:mean(1h) // 1h average
  | op:lt(1000) // less-than 1.000
)
I created a CAQL Check for this query, and setup an email alert for it. I’ll admit, this is probably a little over the top, but I just like to know directly when my stuff is not doing stuff.
Conclusion
It’s still amazing to me with how little effort, you can arrive at a pretty sophisticated monitoring setup if you know your way around Circonus. Also not that the method illustrated here is in pretty universal. If you can extract the numerical digest from any tool on the command line you can follow the steps and get your stuff monitored.
For the specific case in point, the files remaining metric really benefited from taking it into the context of the whole system resource usage. In many cases, dropbox is the one who is using the resources. And it actually uses all of them: network, disks, CPU (to calculate all that checksums) and memory! It’s interesting to know where are the bottlenecks.
The tweet above shows just how much information you can get form a glance at the board. Using the dashboard I discovered, already that
- Drobox has a long time average download rate is about 10Mbit. Not too bad given my shitty internet connection.
- The download stalled after ~24h. So, I added a cron-job to restart it every day.
- I should add more memory to the box. The system is already swapping.
I hope you enjoyed reading this. If you like to be informed about future posts, please consider singing up for the newsletter.